
Give us a URL.
Choose sensible defaults or configure cadence, probe location and check behaviour yourself.
Website URL
https://checkout.example.comAdd service →Uptime monitoring for websites, APIs and servers
Monitor websites, APIs and services. Get alerted when something fails, then see the checks, incident timeline and alert history that explain what happened.
No card required. Free monitors are public. Targets are redacted, but monitor names, status and history can be viewed publicly.
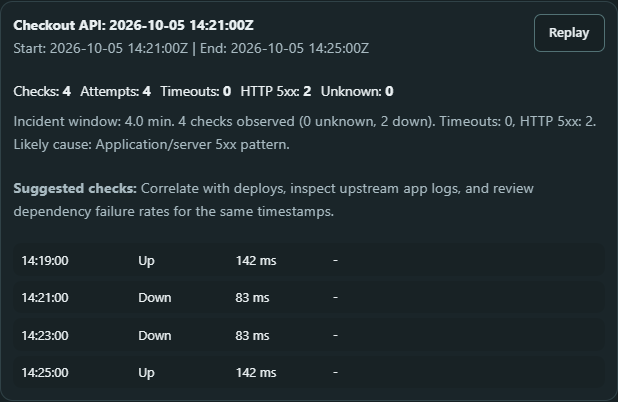 View full-size incident replay ↗
From a failed check to the recovery. Your evidence stays with the service.
Choose sensible defaults or configure cadence, probe location and check behaviour yourself.
https://checkout.example.comAdd service →View response status, latency, check history and incident transitions.
Email, SMTP and webhooks tell you when something needs attention. Test your route and confirm receipt.
Investigate an incident
See the checks that triggered an incident, what changed while it was open, who was notified and whether delivery was accepted.
Follow the failure and recovery in check history, then inspect the alert's delivery evidence. Provider acceptance and confirmed receipt stay distinct.
Explore how Uptimer works →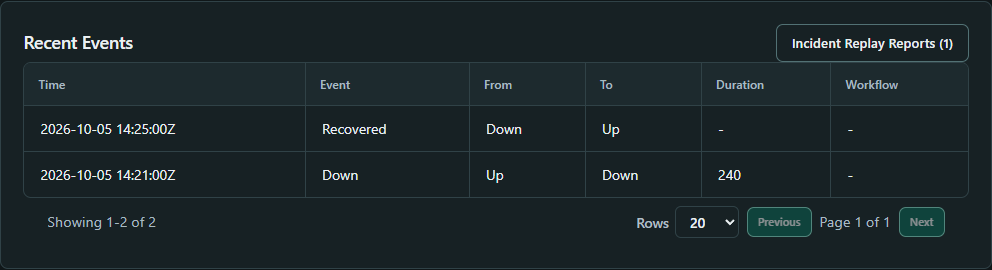 View full-size capture ↗
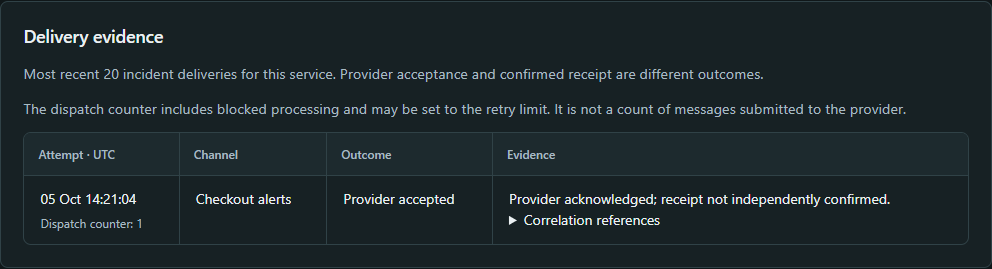 View full-size capture ↗
Free includes health findings, private health predictions and optional early-warning notifications. Pro adds diagnostic evidence, latency trends, recurring failure windows, incident summaries and advisory forecasts.
Use your service's history to understand changes and decide what to investigate next.
Transparent by design: advisory results are labelled with their evidence and limitations. AI transparency →
Connect the tools your team already uses.
Operational proof
Aggregated records from this installation. Counts reflect retained check records, including execution failures, rather than an all-time processing total. Public pages include listed and unlisted monitors in active workspaces, including paused monitors. Tracked services have at least one retained Up check; their latest recorded state is not a freshness or availability guarantee.
Loading recent checks…
| Service | Incident state | Last check · UTC | Public link |
|---|
Start with public monitoring. Choose Pro for private services, shared access and longer history.
For personal projects and public services.
£0 forever
Free monitors are public. Targets are redacted; names, status and history are publicly viewable.
Start FreeFor private services and small teams.
£9 / month
HTTP, TCP, Ping, Keyword, DNS and Cron checks; parent groups; Steam and Minecraft servers. Certificate/domain expiry and RMM remain available for supported check types and effective access.
Read the architectureShared incidents, maintenance, SLOs, API keys, CSV/JSON/PDF reports and configuration import/export. Use the depth you need without completing a compulsory tutorial.
API documentation · Detailed comparisonVerification, MFA, workspace access controls and audit. Business covers organisational identity and deployment requirements, including self-hosted Enterprise.
Business options · Target-owner access controlsOne eligible location executes each scheduled check. Built-in lanes can share a host; independent regions depend on configured probes. Requested cadence depends on available capacity.
Locations and IPs · Technical statistics · Roadmap